You can view your bot's analytics from its Admin Console by clicking on 'Analytics'. Analytics provides graphs and data on the bot's activity in the form of charts and tables. You can navigate through different analytics by selecting a specific social media chart, and further refine it by duration period and grouping.
| Properties | Description |
|---|---|
| Charts | Graphs of different social media interactions. |
| Duration | Displays a graph for a given period of time. User can choose duration of the graph to be displayed for either week, month, or everything. |
| Group By | Groups graph data either by day, week, or month. |
| Properties | Description |
|---|---|
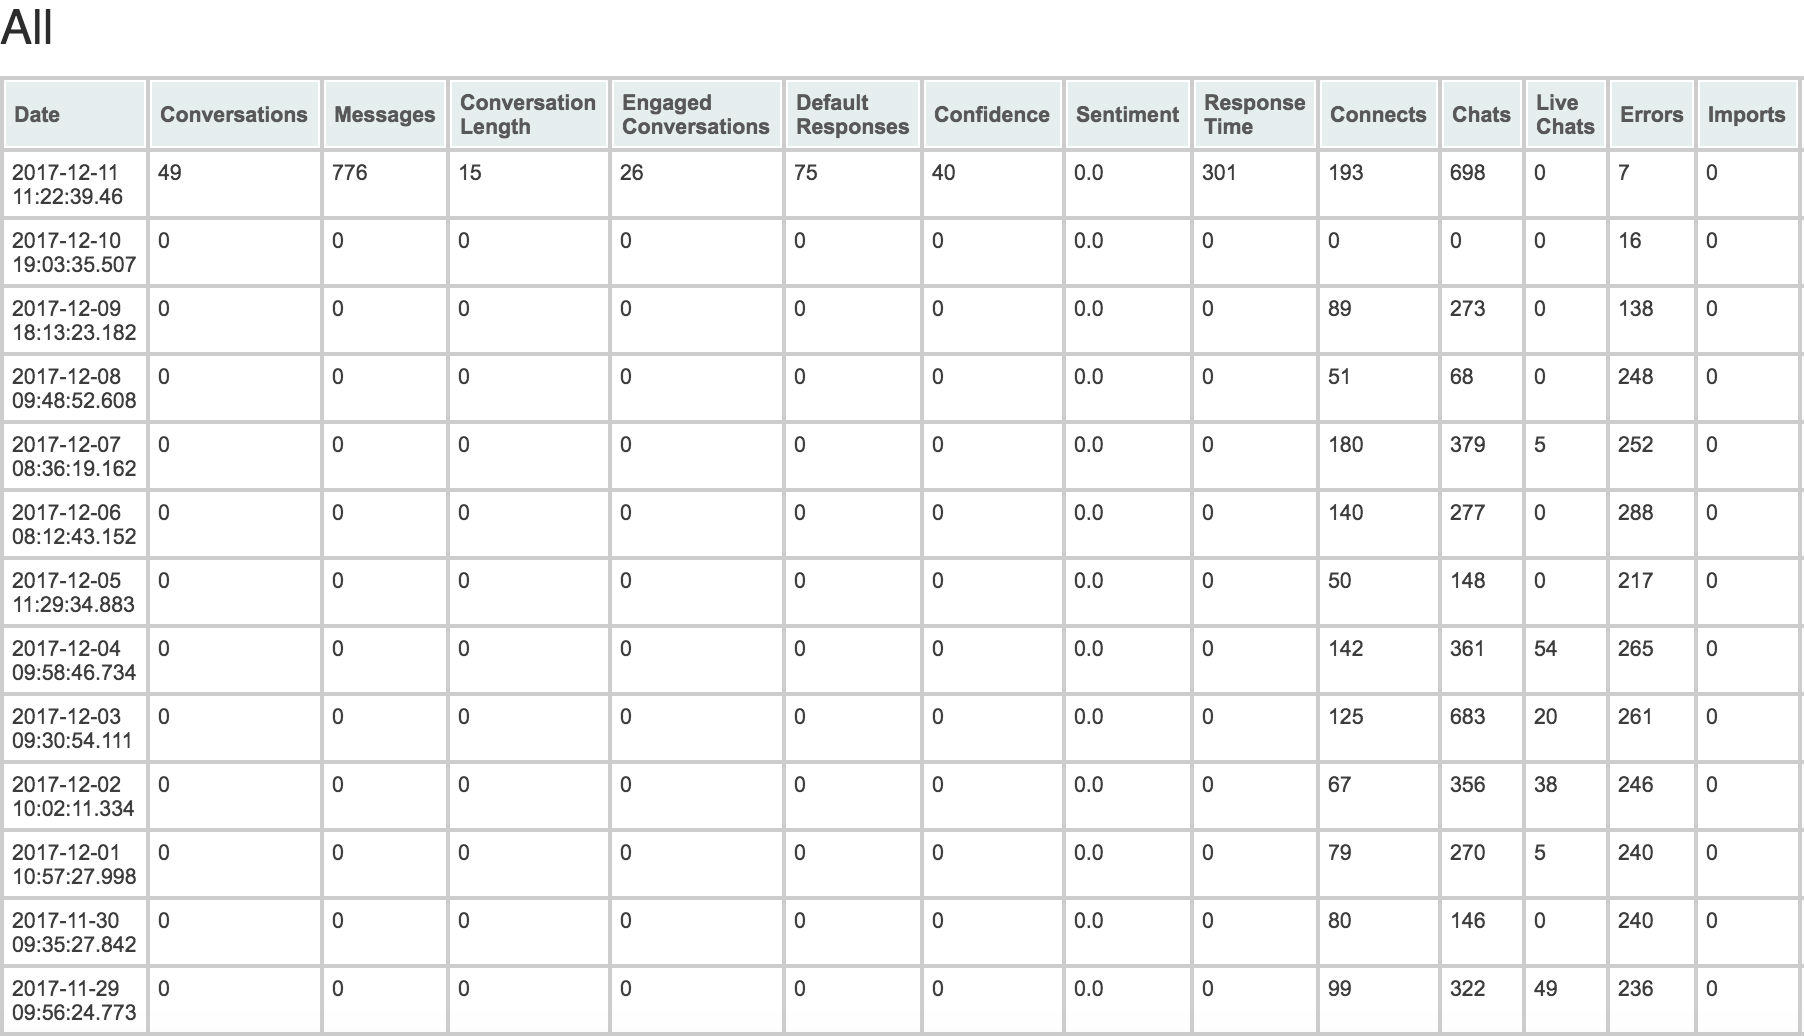
| Conversations | Total conversations the bot had for all chat and social media platforms. |
| Messages | Total messages the bot had for all chat and social media platforms. |
| Conversation Length | Total conversation length the bot had for all chat and social media platforms. |
| Engaged Conversations | Total number of conversations that bot had with at least three messages. |
| Default Responses | Total number of messages the bot did not find an answer for. When the bot does not know a response to a question, it uses its 'default' response. |
| Confidence | Avarage confidence the bot had on its responses based on the user question and the bot's matching trained question. Exact question matches and pattern matches are considered to be 100%, and default responses are 0%. |
| Sentiment | User's average sentiment or emotion to the bot's responses, either good or bad. If the user's questions seem very happy the sentiment will be 100%. If the user seems very unhappy the sentiment will be -100%. If the user did not express any emotion, then the sentiment will be 0%. |
| Connects | Total number of times a user or admin connected to the bot through the web or mobile. |
| Chats | Total number of chats that the bot had. |
| Live Chats | Total number of live chats that the bod had. |
| Errors | Total number of errors the bot had while responding to chats. |
| Response Time | How long it took the bot to respond the the user's message for chat and all social media platforms. |
| Imports | Total number of scripts or response lists imported into the bot. |
| Tweets | Total number of tweets the bot posted for Twitter social media. |
| Retweets | Total number of retweets the bot has made for Twitter social media. |
| Tweets Processed | Total number of tweets bot has read. |
| Direct Messages | Total number of private, user to user chat message for Twitter social media. |
| Facebook Posts | Total number of Facebook posts the bot has made for Facebook social media. |
| Facebook Likes | Total number of Facebook posts that bot 'likes'. |
| Facebook Messages | Total number of Facebook posts processed by the bot for Facebook social media. |
| Facebook Messages Processed | Total number of Facebook messages that the bot has read for Facebook social media. |
| Skype Messages | Total number of Skype messages the bot has read. |
| Kik Messages | Total number of Kik messages the bot has read. |
| WeChat Messages | Total number of WeChat messages the bot has read. |
| WhatsApp Messages | Total number of WhatsApp messages the bot has read. |
| Slack Messages | Total number of Slack messages the bot has read. |
| Slack Posts | Total number of Slack posts the bot has made for Slack social media. |
| Telegram Messages | Total number of Telegram messages the bot has read. |
| Telegram Posts | Total number of Telegram posts the bot has made for Telegram social media. |
| Total number of emails the bod has sent. | |
| Emails Processed | Total number of emails the bot has read. |
| SMS Sent | Total number of SMS messages the bot has sent. |
| SMS Processed | Total number of SMS messages the bot has read. |
Choose any of the 11 available bot's analytics charts you want to see by selecting it from 'Charts' drop down select. You can view bot's chart for a duration preriod of either current week, current month, or all time by selecting a duration period from the duration drop down select. You can group bot's analytics either by day, week, or month by selecting a group from a group by drop down select.
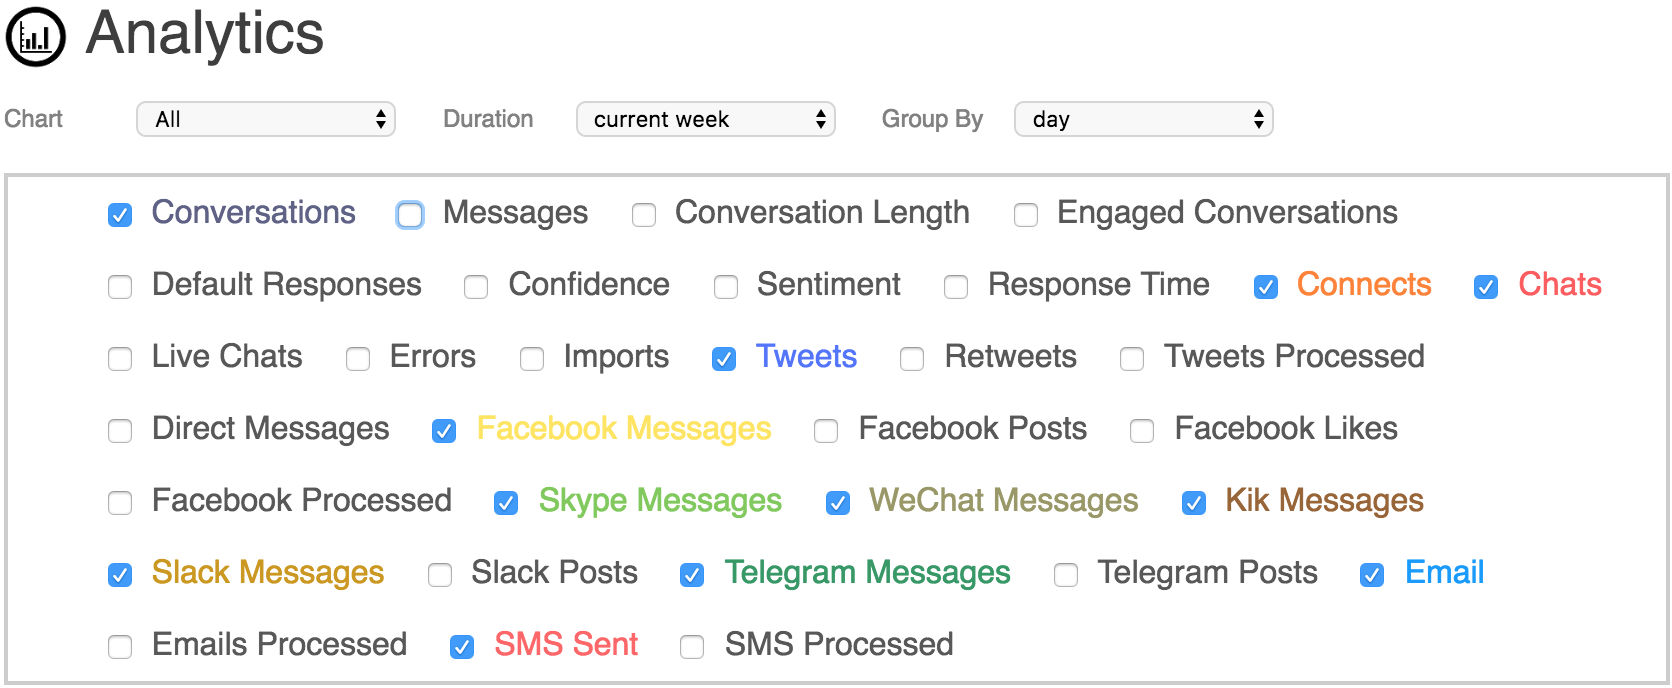
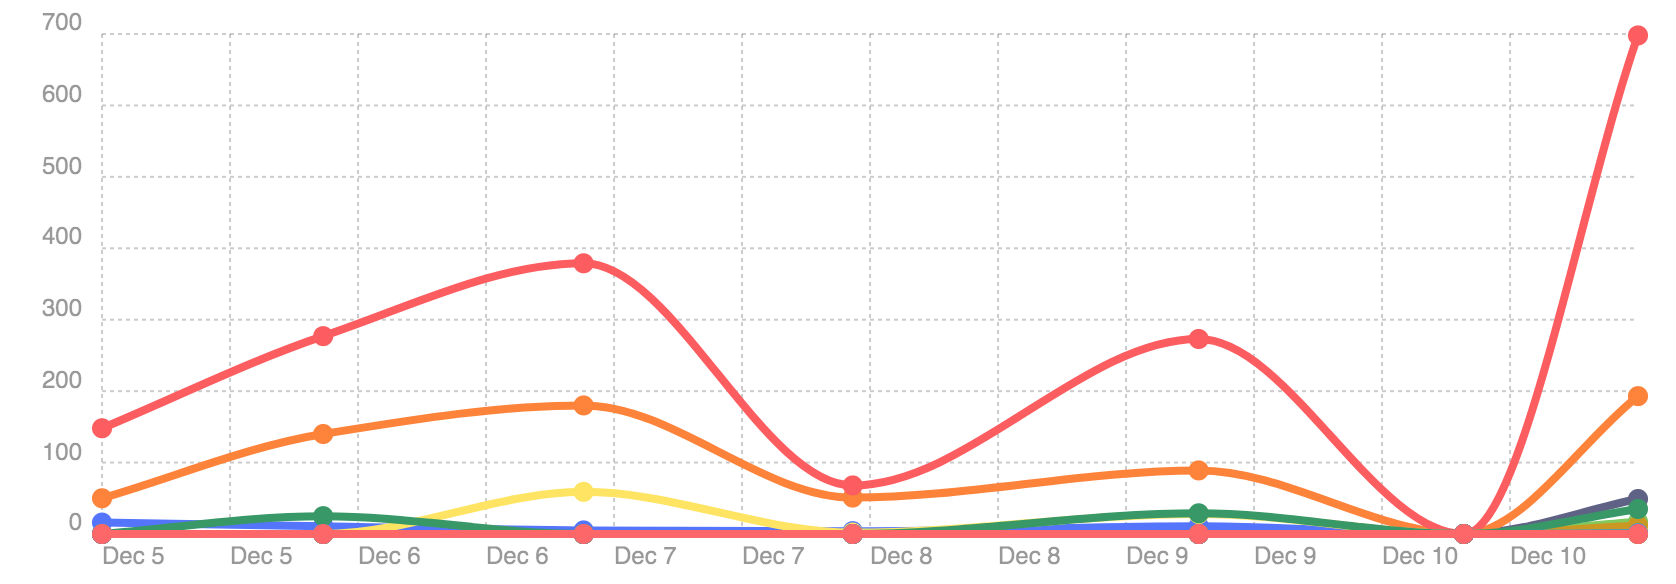
Table stats displays bot's raw analytic data in a table. The data in the table is graphed in a chart above. You can sort the bot's analytics in the table by any column by clicking on the column's title.